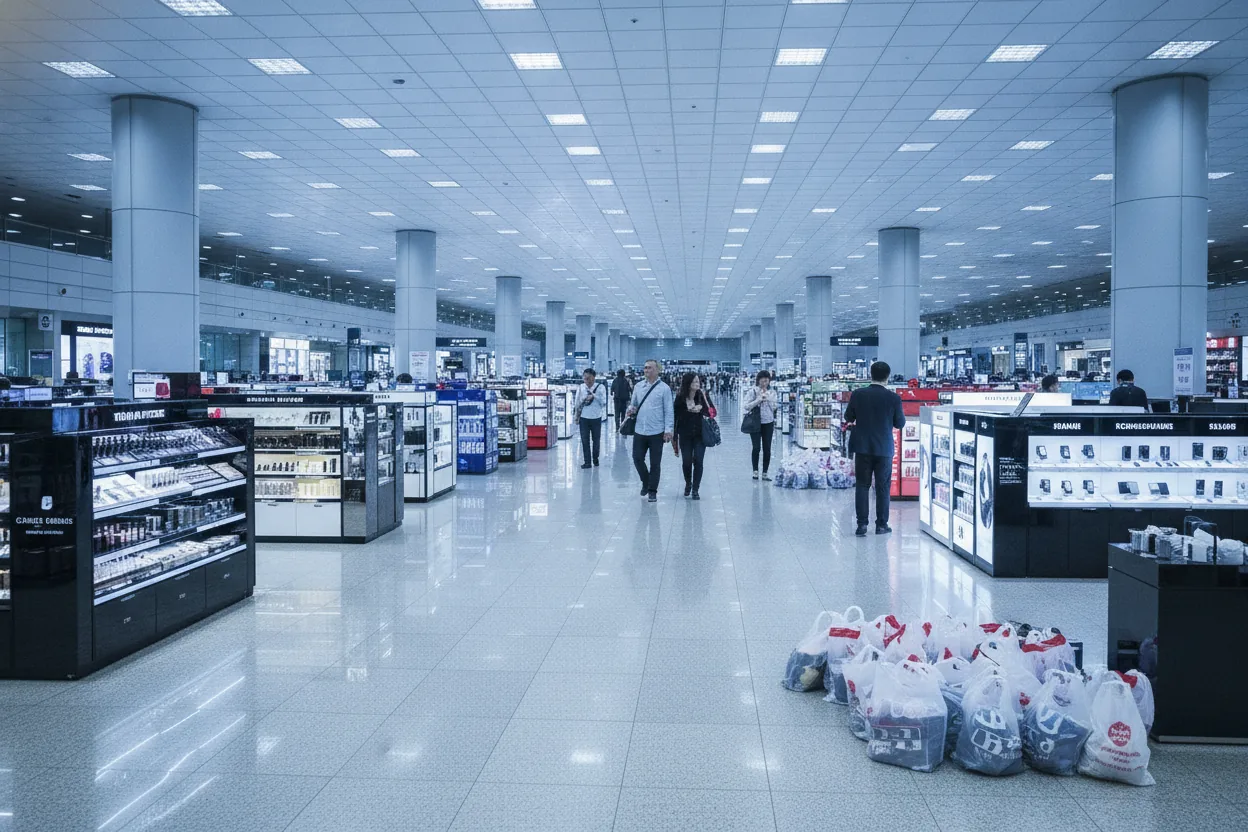
Korea is on track to welcome 22 million foreign visitors in 2026, yet the revenue those visitors generate is running on a fundamentally different timetable than the headcount recovery the tourism industry is celebrating. The inbound model was engineered around high-volume Chinese group tours producing outsized duty free and retail receipts, a formula that once let a smaller number of visitors generate more money than a larger number does today. That gap between bodies arriving and money actually spent is the real story inside Korea's recovery, and the data on who is coming, how they arrive, and what they buy reveals why the triumphant headline conceals a structural problem the 22 million figure alone cannot resolve.
The Korea Culture and Tourism Institute forecast gives the headline a triumphant shape: visitor volumes approaching pre-pandemic scale, Chinese demand rebounding, Southeast Asian corridors reopening. Look one layer deeper and the architecture of that recovery is uneven in ways that matter for every sector attached to inbound spend, from duty free operators like Lotte and Shinsegae to the Myeongdong merchants who watched Chinese group tours disappear for three years and are still waiting for them to come back at the same ticket size.
The decisive analytical point is this: headcount recovery and spending recovery are running on different timetables, and Korean tourism policy is currently optimized for the first while underestimating the drag created by the second.
China Is Back, But Not to 2016
Chinese Visitors to Korea: 2026 Projection vs 2016 Peak
The headline recovery conceals a gap of 1.35 million visitors that has not yet closed
|
2016 Peak Year 8.07M Chinese visitors High-volume group tours Peak duty free spend 100% of benchmark |
2026 Projected 6.72M Chinese visitors Lower transaction sizes Shifted spend profile Only 83% of benchmark |
Source: Korea Culture and Tourism Institute forecast; 2016 inbound tourism records
The 6.72 million Chinese visitor projection for 2026 carries a figure worth pausing on. It represents approximately 83% of the 8.07 million reported in 2016, the peak year for Chinese inbound tourism to Korea before the THAAD diplomatic freeze compressed the market almost overnight. A double-digit year-over-year increase sounds like momentum. Measured against 2016, it is still a gap of roughly 1.35 million visitors that has not closed.
What is driving the partial recovery is a specific policy package: visa-free group tour arrangements, restored flight routes between Chinese tier-two cities and Korean regional airports, and a relative softening of demand for Japan travel among Chinese tourists. That last variable is worth watching carefully. Chinese consumer sentiment toward Japan has shifted for reasons that have nothing to do with Korea, and Korea has benefited from that redirection. The question is whether that benefit is structural or temporary. Redirected demand that arrives because a competitor lost favor tends to be price sensitive, comparison driven, and quick to reverse.
The per-visitor spend profile of the returning Chinese traveler also appears to have shifted. Group tour packages, which once anchored cosmetics and luxury duty free purchases at volumes that sustained the entire inbound retail model, are coming back at lower average transaction sizes. Whether that reflects changed consumer preferences, tighter household budgets in China post-property cycle, or simply a different demographic mix in the returning cohort is not fully resolved in the available data. What payment data patterns suggest is that 6.72 million Chinese visitors in 2026 will not produce the same duty free and retail revenue that a smaller number produced in 2016.
For Korea's duty free sector, which restructured painfully between 2017 and 2022 and has been waiting for a Chinese volume recovery to justify that restructuring, the partial return of numbers without the return of per-visitor economics is not a clean win. Lotte Duty Free and Shilla are collecting the headline, not the margin.
How K-ETA Friction Shapes the Recovery
Chinese Visitor Volume to Korea: From Peak to Partial Recovery
Visitor millions , THAAD freeze, pandemic, and partial return
Peak
THAAD
Pandemic
Rebound
Forecast
2024 figure is illustrative estimate based on article context
Source: Korea inbound tourism records; Korea Culture and Tourism Institute 2026 forecast
Korea's Electronic Travel Authorization system is functioning in this recovery story less as a security mechanism and more as an accidental market sorter. The way different Southeast Asian source markets are recovering at different speeds maps almost directly onto whether K-ETA requirements apply to them, and the Thailand situation from 2024 is the clearest illustration of how a policy friction can embed itself in a market's behavior long after the specific incident that caused it.
The controversy around K-ETA application to Thai visitors in 2024 did not just affect 2024 arrivals. Payment data from 2025 and the forward-looking forecast shape for 2026 both carry the imprint of that friction. Travel behavior, particularly from markets where Korea is one of several competitive destinations rather than a singular aspiration, is sensitive to friction at the entry point in ways that aggregate visitor statistics tend to undercount. A traveler who considers Korea and then books Vietnam instead does not appear in any Korean tourism dataset at all.
Taiwan and Hong Kong present a different pattern. Payment data from 2025 tracking inbound visitor spending from those two markets showed recovery characteristics distinct from mainland China and distinct from Southeast Asia. Taiwan in particular has maintained a visitor profile oriented toward independent travel, repeat visitation, and cultural consumption rather than group shopping. That produces steadier per-visit spend even at lower absolute volumes, which is structurally different from the volatility that comes with group-tour-dependent markets.
The broader implication is that Korean tourism's recovery is being shaped as much by administrative policy design as by demand fundamentals. That is not unusual in a market where the government functions as an active participant in visitor flow management. But it means the 22 million figure carries a policy contingency inside it that pure demand forecasting tends to obscure. The Korea Tourism Organization is optimizing for a number when it should be optimizing for resilience.
Why American Visitor Growth Is the Structural Surprise
Why Headcount Recovery Does Not Equal Revenue Recovery
The structural breakdown: from visitor arrival to duty free margin
22M total visitors projected for 2026, Chinese cohort at 6.72M
Group tour volumes return, but at lower average transaction sizes per visitor
Visitors choosing Korea over Japan due to sentiment shifts, not loyalty, spend comparatively less
Lotte and Shilla collect the headline visitor number, not the 2016-era margin per visitor
Policy optimized for arrivals, not per-visitor economics. The 22M figure conceals the real problem.
Source: Article analysis based on Korea Culture and Tourism Institute data and duty free sector trends
The United States appears to be showing one of the strongest recovery rates compared to 2019 among major source markets, a trend that cuts against the instinct to read Korea's inbound tourism story as primarily an East Asian phenomenon. American visitors are arriving at volumes that exceed pre-pandemic levels by a margin few other major markets have matched, and the structural explanation for that growth sits squarely inside the decade-long global expansion of Korean cultural product.
BTS drove the first wave of American consumer attention to Korea as a physical destination rather than just a streaming location. What followed built on that foundation without depending on it. Korean film, television, food, and beauty products each created their own entry points for American visitors who arrive with specific consumption itineraries, neighborhoods mapped in advance, restaurants booked weeks out. This is a visitor segment that plans around Seongsu and Ikseon, not just Myeongdong and Gyeongbokgung.
The spend profile of the American visitor also skews differently from the Chinese group tour model. Higher average spend per day, longer average stays in certain segments, and a stronger orientation toward experience over product creates a revenue pattern that is more durable but harder to scale through the kind of group logistics that Korean inbound tourism infrastructure was historically built around.
What the American growth rate actually signals is that Korea has diversified its inbound source market mix in a way that was not deliberate policy but emerged as a consequence of cultural export strategy. The diversification was not planned by the Korea Tourism Organization. It was produced by HYBE, Netflix, and CJ ENM, and tourism is collecting the downstream benefit. That matters because cultural pipelines are not trade policy levers, and the Korea Tourism Organization cannot replicate them by budget allocation alone.
More Visitors, Less Revenue Per Head
Korea's inbound tourism model was built on a specific formula: high-volume Chinese group tours generating outsized retail and duty free revenue that subsidized the broader tourism infrastructure. That formula produced numbers in 2016 that the current recovery, even at 22 million total visitors, has not reconstructed. The mix has shifted toward markets and visitor types that generate different economic outputs at the sector level.
The duty free operators are the most direct measure of this tension. Lotte Duty Free and Shilla have faced sustained pressure on their airport and downtown operations since 2017 not simply because Chinese visitors disappeared, but because the specific purchasing behavior that made those operations profitable proved difficult to replace with any other visitor segment at comparable margins. American visitors buy differently. Southeast Asian independent travelers buy differently. The volume may approach 2016 equivalents. The basket size almost certainly does not.
K-ETA friction, Chinese spend per visit as a structural question, and the American growth story all feed into the same underlying dynamic: a 22 million visitor projection that looks like a recovery headline but actually describes a market in structural transition. The question Korean tourism policy needs to answer is not how to get back to 2016. That market no longer exists in its original form. The question is how to build revenue infrastructure around the visitor mix that is actually arriving in 2026, which requires different physical spaces, different service models, and different cities.
Seoul will capture the majority of that 22 million regardless. But the markets and visitor types driving the growth are already moving through a Korea that looks less like the duty free corridor between Incheon and Myeongdong and more like the independent travel circuit connecting Busan, Jeonju, Gyeongju, and the kind of Seongsu side street that does not appear in any tourism ministry brochure. Whether Korean tourism infrastructure catches up with that reality before the next demand cycle turns is the tension that the 22 million forecast cannot answer on its own. The operators positioned for that transition inherit the recovery. The ones still waiting for 2016 to return are waiting for a market that is gone.
This article is for informational and educational purposes only and does not constitute financial, investment, or legal advice. Views expressed are analytical observations and should not be relied upon for personal financial decisions. Consult a qualified financial advisor before making investment decisions.